(continued from Navigating Data on Device)
RM Monitor has eight data categories to help you run your business more effectively. Each category will contain sets of information specific to the selected category. An example is the hourly report will break sales, customers, and various other informational data broken down by each hour. In this section we will breakdown the information contained in each category.
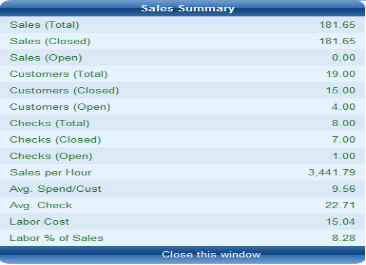
The Sales Summary Report gives a basic snapshot of the sales for a current session. The report has 15 columns (on desktop) that can be navigated using the scroll bar on the bottom of the page or rows (mobile devices). Below is a breakdown of the information listed on the Sales Summary Report.
Sales Totals- Net dollar amount of all sales including both closed checks and the dollar amount of checks still open.
Sales (Closed) - Net dollar totals belonging to checks that are closed (settled)
Sales (Open) - Net dollar totals belonging to checks that are still open (not settled)
Customers (Totals) Customer counts belonging to both closed checks and checks still open.
Customers (Closed) - Customer counts associated with checks that are closed (settled)
Customers (Open) - Customer counts associated with checks still open (not settled)
Checks (Totals) - Total number of checks that have been opened during the session
Checks (Closed) - Number have checks that have been closed during the session
Checks (Open) - Number of checks that have been and remained unsettled.
Sales per Hour- Total Sales divided by hours open.
Avg. Spend/Cust- Total sales divided by total customer count
Avg. Check- Total Sales divided by total number of checks (includes discounts)
Labor Cost- Total labor dollars (sum of hours multiplied by wage per employee)
Labor % of Sales- Labor cost divided by total sales
View (Available on Desktop only)- When selected, this option produces a summary screen with all the totals as shown below:
Note: Net Sales do not include taxes or tips. Net sales do include discounts.
The Alerts Report gives you key real time data aiding you to manage your business. The alerts appearing in this report are configurable through RM Alerts. Some of the information available is:
The Alerts Report is broken down into nine categories:
Alert Type – the information in this category reflects the name of the alert triggered.
Ref Value- Reflects the default threshold value set up in RM Alerts
Actual Value- The value is dependent on the trigger mechanism unique to the alert. As example the # Deletions may reflect the actual number of deletions where the trigger may have been five deletions.
Employee- This reflects the employee name whom the check belongs to or who may have affected the alert.
Table/ Tab- The table or tab number that was affected.
Comment- A brief summary of the alert. Each comment is unique to the programmed alert.
Subject- The alert title
EmployeeID- The employee number whom the check belongs to or who may have affected the alert.
Alert Type Number- the alert number as defined in the Alerts setup form in the RM BackOffice (Setup > General > Alerts)
View (Available on Desktop only) - When selected, this option produces a summary screen for the alert with the information below:
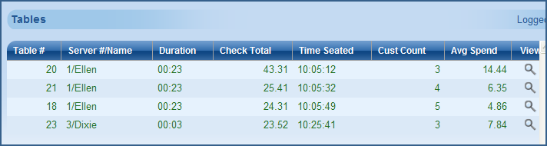
The Tables report gives the user summary information for open tables. The report is broken down is broken down into six categories:
Table # - The table number of open check. Note table alias do not transport to RM Monitor.
Server#/ Name- shows the employee number and name who opened the check or who owns the table
Duration- The length of time the check has been open.
Check Total- The net sales of the check
Time Seated- The time the check was opened.
Customer count- the amount of customers assigned to check
Avg Spend- Net sales divided by customers
View (Desktop Only) - A summary of categories for the particular table selected.
In the desktop screen shot below we could ask why Ellen was seated three tables at once or question why the average spend on table 18 is so low:
Note: Net Sales do not include taxes or tips. Net sales do include discounts.
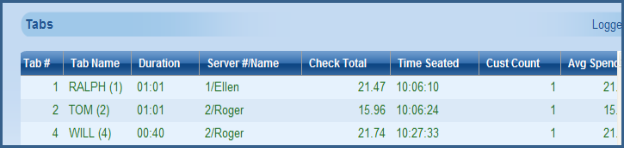
Similar to the Tables report, the Tabs reports list all the open tabs for the session. The Tabs report is broken down into eight categories:
Tab#- The number in this category is the sequential number assigned to the tab when opened.
Tab Name- The name/ reference assigned to the tab (manually typed or CC Swipe)
Duration- The amount of time the tab has been open.
Server#/Name- The employee number and name that open the tab or who the tab belongs to.
Check Total- The net sales belonging to the tab
Time Seated- The time the tab was opened
Customer Count- Customer account assigned to tab (dependent on customer prompt).
Avg Spend- This number is the net sales (check total) divided by customer count
View(Desktop Only)- A summary of categories for the particular table selected.
The Screen Shot below is the desktop version of the tab report:
Note: Net Sales do not include taxes or tips. Net sales do include discounts.
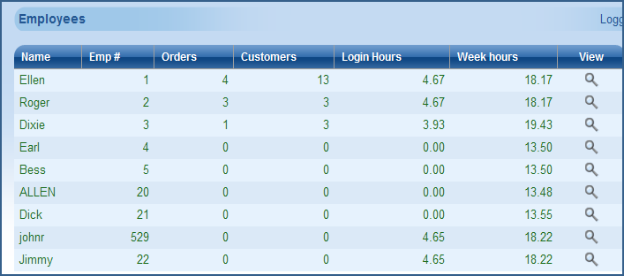
The Employee reports lists all employees who have logged in for the week. The report will give you daily as well cumulative weekly hours making this an excellent source to monitor one of your largest controllable expenses. The report grid consists of six categories:
Name- The employee’s name taken from the POS name from the Employee Setup form
Emp#- The employee associated with the employee and taken from the Employee Setup form.
Orders- The cumulative number of order the employee has started in the current session.
Customers- The cumulative customer count for all checks open by the employee during the current session
Login Hours- Employee’s current hours for the day
Week Hours- Cumulative weekly hours for the employee
View (Desktop Only)- A summary of categories for the particular employee selected.
The Screen Shot below is the desktop version of the Employee report:
The Hourly report breaks down sales and labor information at 60 minute intervals. This report is ideal for checking trends in customer counts and labor percentages along with other important information. The Hourly report is broken into seven categories:
Time- denotes the time slot. The beginning time (top of report) reflect the hour in which the first sale was rung.
$Sales- Net dollar figure for the hour
Cust- Customer count for the hour slot
Avg- Net sales divided by customer count
F/C- Dollar amount of food cost for the hour
Lab$- Cumulative dollar amount of labor (wages) for the hour slot
Lab%- Labor dollars divided by net sales
View (desktop only)- A summary of categories for the particular hour selected.
The Screen Shot below is the desktop version of the Employee report:
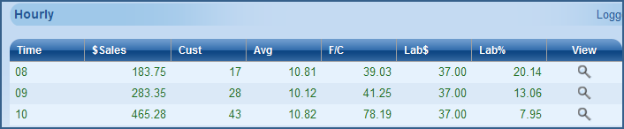
In the report above, we can see our most profitable hour is 10-11. A manager may want to cut back on labor in the opening hour depending on the circumstance.
Note: Net Sales do not include taxes or tips. Net sales do include discounts.
The Audit report will track information on checks that may be peculiar to normal operations. The information displayed (or not displayed) is contingent on the Audit Trail settings found in the station configuration in the RM BackOffice module. As example, an option marked “No Audit” in Audit Trail Levels of station configuration will not appear on this report. The Audit report is broken down into ten categories:
Order #- Restaurant Manager automatically assigns an order number every time a new transaction is started. The number in this category is associated with the transactions order number.
Type- The type refers to the specific audit number as defined in the audit.dbf.
Description- The description is associated with the name of the audit defined in Audit Levels in station configuration of the RM BackOffice module.
Time- The time the action took place at the POS.
Amount- The figure in this category reflects the dollar amount of the transaction at the time of the auditable auction.
Stn- This number reflects the POS station number where the auditable action occurred.
Emp- Shows the employee number of the employee who owns the check.
Pass Emp- The employee number of the employee whose password was used to affect the auditable action.
New Value- The number in this category is determined by the action performed at the POS and the audit itself. An example might be when an employee transfers a check. The new value will be the employee number who received the check or who is the new owner of the check. Likewise, if a check is discounted, the number in this column would be the number of discounts applied.
Reference- The reference is subject to the type of action being audited. A transferred checked will list the table being affected where an item discount will list the specific item discounted.
Table/Tab- This category shows the table or tab number being affected.
View (desktop only) - A summary of categories for the particular audit line selected.
The Screen Shot below is the desktop version of the Audit report:
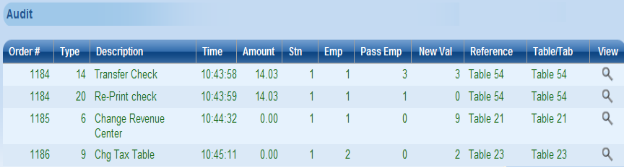
Using this report a manager may question why employee 1 has so many changes or why employee two changed the tax table on a transaction.
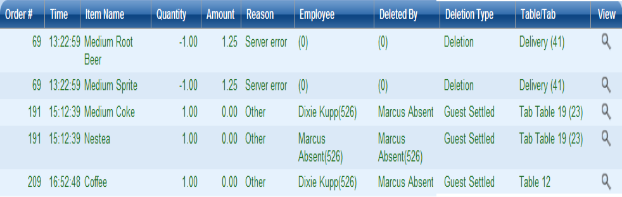
The Deletions report list items taken off a check using the “Delete” function at the POS or using the “Guest” form of payment. This report is ideal for monitoring mis-rings or potential theft. The report is broken down into six categories:
Amount- Lists the dollar amount of item being deleted
Reason- Lists the reason for the deletion. The deletion reasons are configurable in the RM BackOffice module under Setup > General > Deletion Codes.
Employee- This category lists the employee name and number to whom the check belongs to.
Deleted by- The value will reflect the employee name and number whose password was used to delete the items.
Deletion Type- This category lists the method used to delete items from the check (i.e. Discount function button or “Guest settlement option when enabled).
Table/Tab- This category shows the table, tab, or delivery number being affected
View (desktop only)- A summary of categories for the particular deletion selected.
The Screen Shot below is the desktop version of the Deletion report: